By Christopher Duston
This is a story about hypothesis and fact-checking on the gun-violence debate. And about how proving you are wrong about something is better the thinking you are right.
I was listening to an interview on NPR with Jack Levin, a sociologist and criminologist from Northwestern Northeastern University in Boston. He commented that there are not very many similarities between the shooters in these mass killings, making it hard for policy-makers to target the problem. However, he said most of them had some kind of “history of depression.” I did not verify the accuracy of that statement, but that suddenly made sense to me – it is at least believable that citizens in a 21st century United States face new social, economic, and technological challenges that could increase the rate of depression.
The details of this depression-link (if it even exists) would be very complicated, but if we claim that it is because of some kind of major change in our society, we should look for an indicator that detects such large scale phenomena. In other words, it can’t just be the growing income gap that is causing us to unleash outlandish violence against each other.
So we need something that will measure the “total health of a society”; such things exist, for instance the Legatum Prosperity Index (LPI), which takes into account various factors such as economy, healthcare, and personal freedom. This seems like something that would track what I’m interested in, since the basic claim is that there are a number of different factors, which together contribute to an increase in gun violence.
And, the great thing about the LPI is that Wikipedia lists the top 30 (and bottom 20) countries for the years 2012-2008. You don’t need a degree in criminology or a class in statistics to look at numbers.
We want to compare to gun violence rates; again, Wikipedia helps! You can get the firearm-related death rate (per 100,000 population). You can even sort it. (Although, this is ALL firearm-related deaths; I am not isolating mass shootings. In this case, Wikipedia’s entries are so detailed that broad categorization is hard).
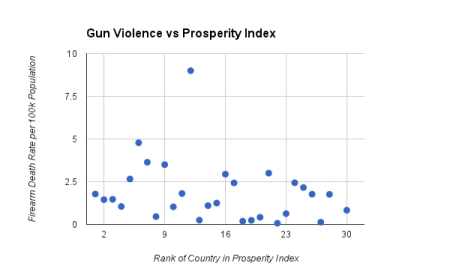
So, with the most basic data analysis software you can imagine (Google Docs), I made a spreadsheet of the LPI rank of each country and their firearm-related death rate. I was already writing my segment as a guest on Rachael Maddow…but then I made the plot. Well I was wrong. As you can see, there is zero correlation between the LPI rank and firearm-related deaths.
But this doesn’t mean we didn’t learn anything. The LPI is not a discriminating enough tool; my interpretation is therefore that gun violence is not connected to “quality of life,” broadly defined. Of course, there are all kinds of other possibilities, but this is a simple analysis, and so I restrict myself to simple (and imprecise) statements.
I’m not saying there is a complete lack of analyses out there about the violent nature of the United States – I won’t do a literature search, but good people certainly work on the problem. However, with the democratization of data, we need to acknowledge that no one should be allowed to get away with statements that are not backed up by at least a minimum of quantitative analysis. This analysis took me about 35 minutes. I just came up with something I thought was brilliant, hopped over to Wikipedia to mine some data, plotted it using a FREE online service, and proved myself wrong. Study over.
Police yourself!
PS: One guess as to which blue dot is the U.S. Yup, it’s that one. Yeah, we have less gun violence per capita than the likes of Mexico (LPI rank 61), Brazil (44), and Colombia (69), but that is not the group we should be in.
Christopher Duston is a graduate student in the physics department at Florida State University. His research focuses on mathematical physics and quantum gravity, and he will receive his Ph.D. in May 2013.


